The best day of the week or perhaps the month is...
I'm concerned about next week.
The European weather model is forecasting actual air temperatures in excess of 100 degrees for a couple of days next week. The Euro or the ECMWF is generally considered to be the most accurate of all the computer weather models. The trouble with these heat waves is that when they set up, they don't want to leave.

Summer Heat Wave Watch issed!
No, not really. I just made that category up. Two out of the three popular computer models have extreme heat lasting until June 26. The American GFS model keeps us in the low to mid 90's during the week of June 20th. Here's what the European and Canadian models say (respectively):


Does anyone remember the heat wave of 2012?
Oh boy! That was a terrible heat wave. It was worse than any I've experienced living down south. Let's hope that this current pattern does not repeat what we had in the summer of 2012. I remember my outdoor thermometer saying 106 degrees at some point during that heat wave. Here are some links to the blast from the past:
HT: Weather: We're havin' a heat wave
The National Weather Service office in Indianapolis summary page
Wikipedia: 2012 North American heat wave
New York Tines: Not Even Close: 2012 Was Hottest Ever in U.S.
Here are the actual temperature for June and July of 2012:
Time Temperature (°F) Dew Point (°F) Humidity (%) Wind Speed (mph) Pressure (in) Precipitation (in)
Jun Max Avg Min Max Avg Min Max Avg Min Max Avg Min Max Avg Min Total
1 60 56.3 53 58 50.3 46 93 80.6 62 22 13 5 29 28.9 28.8 0
2 71 59.4 48 53 47.5 42 90 67.6 39 22 12.1 3 29 29 29 0
3 80 67.2 51 57 52.1 49 97 62.9 35 16 8.8 3 29 29 29 0
4 76 67.9 63 61 56.4 49 84 67 49 14 7.5 0 29 29 28.9 0
5 73 64.6 55 52 49.2 46 80 58.7 40 18 9.9 5 29.1 29.1 29 0
6 75 64.8 52 48 45.3 43 74 52 34 16 8.1 0 29.2 29.1 29.1 0
7 82 69.8 54 52 47.1 44 80 48.2 27 9 4 0 29.2 29.2 29.2 0
8 85 73.3 57 53 47.7 44 77 43.8 25 8 3.4 0 29.2 29.2 29.1 0
9 86 74.4 61 55 51.7 48 73 47.8 28 14 6.1 0 29.2 29.1 29.1 0
10 90 78.4 67 63 58.6 53 70 52 35 20 8.9 0 29.1 29.1 29.1 0
11 82 75 70 69 66.6 63 88 75.6 62 16 8.3 5 29.1 29.1 29 0
12 82 73.8 65 68 52.5 39 97 53.9 22 22 12.8 6 29.2 29.1 29 0
13 79 68.9 56 52 47.8 42 69 48.7 34 15 9.3 5 29.3 29.2 29.2 0
14 85 72.6 59 47 42.2 36 53 35.6 17 10 7.3 5 29.3 29.2 29.2 0
15 90 76.6 59 54 48.2 40 75 39.9 17 9 4.6 0 29.3 29.2 29.2 0
16 92 80 68 70 62.5 55 75 57 32 15 9.3 5 29.3 29.2 29.1 0
17 86 79.6 74 67 64.7 62 79 61.4 44 17 11 0 29.1 29.1 29 0
18 92 81.7 72 67 63.9 59 84 57.3 33 25 14.6 7 29.1 29 29 0
19 92 81.3 70 66 62.6 60 78 54.8 35 18 11.9 6 29.2 29.1 29.1 0
20 92 82.6 70 64 61.6 58 78 51.1 32 18 11.6 5 29.3 29.2 29.1 0
21 91 79.1 70 67 62.8 58 87 59.7 33 28 12.7 7 29.1 29.1 29 0
22 86 72.3 64 67 60.4 51 100 73.2 30 15 5.3 0 29.1 29.1 29.1 0
23 88 76.9 63 54 50 47 67 41.5 25 8 4.1 0 29.2 29.1 29.1 0
24 91 82.2 73 59 54.1 52 52 38.8 27 12 5.4 0 29.1 29.1 29 0
25 86 78.8 70 62 50.8 38 64 40.9 19 20 12.4 3 29.1 29.1 29 0
26 82 72.3 60 45 43.1 41 57 36.5 24 15 8.9 5 29.2 29.1 29.1 0
27 91 77.2 61 52 48.2 46 62 38.1 22 14 8.3 0 29.2 29.1 29 0
28 104 87.4 70 68 59.6 52 55 40.2 27 24 12.7 6 29 29 28.9 0
29 102 85.4 74 77 67.5 61 82 56 39 37 9.2 0 29 29 28.9 0
30 96 81.8 70 70 65 62 84 59.6 32 36 10.1 0 29.1 29 28.9 0
Time Temperature (°F) Dew Point (°F) Humidity (%) Wind Speed (mph) Pressure (in) Precipitation (in)
Jul Max Avg Min Max Avg Min Max Avg Min Max Avg Min Max Avg Min Total
1 94 81.8 75 70 66 61 83 59.7 43 21 6.3 0 29.1 29.1 29 0
2 97 83.3 70 68 65.6 63 87 57.6 36 12 4.7 0 29.2 29.1 29.1 0
3 98 85.1 72 66 63.9 61 76 50.9 30 14 7.9 0 29.1 29.1 29 0
4 101 88.7 75 70 67.4 64 79 52.2 30 15 7.7 3 29.1 29 29 0
5 102 90.3 76 70 65 59 79 46.8 24 15 6.6 0 29.1 29.1 29 0
6 103 92.1 78 74 67.7 64 71 47 28 12 4 0 29.1 29.1 29 0
7 105 93.8 81 75 68.7 61 79 47.4 24 13 5 0 29.1 29.1 29 0
8 96 83.3 77 74 67.8 61 78 60.5 36 22 8.5 0 29.1 29.1 29.1 0
9 91 81.6 71 65 57.6 50 75 47.2 24 12 7.3 0 29.2 29.1 29.1 0
10 91 82.5 73 60 54.8 49 59 40.3 23 14 9 5 29.2 29.1 29.1 0
11 92 83 72 59 52.5 49 55 36.2 25 15 9.2 5 29.2 29.2 29.1 0
12 94 82.3 72 66 57.4 49 64 44.3 26 17 9.4 6 29.2 29.2 29.1 0
13 90 80 70 67 64.8 62 90 62 39 12 7.5 5 29.2 29.2 29.1 0
14 87 79.8 72 70 68 66 87 68.1 49 12 8.3 3 29.3 29.2 29.1 0
15 95 81 72 72 68.1 62 94 68.5 33 17 8.6 3 29.3 29.2 29.1 0
16 98 86 74 71 67.4 61 87 56.9 30 13 8.1 5 29.2 29.1 29 0
17 100 86.8 77 72 69.2 66 79 58 33 16 8.2 3 29.1 29 29 0
18 97 82.3 76 73 71.3 67 87 70.5 37 31 9.2 0 29.1 29.1 29 0
19 92 80.2 74 76 72.2 70 91 77.5 52 21 8.8 0 29.1 29 28.9 0
20 80 74.3 72 72 67.9 60 94 81 52 16 10 5 29.2 29.1 29 0
21 89 76.8 63 63 57.7 51 90 56 29 9 4.7 0 29.2 29.2 29.2 0
22 95 82.3 69 64 61.4 59 78 51.7 32 13 5.3 0 29.3 29.2 29.2 0
23 101 87.3 74 69 65.2 61 71 49.8 30 21 12.1 5 29.2 29.1 29.1 0
24 95 86 79 71 67.5 61 74 55.5 33 18 9.5 0 29.1 29.1 29 0
25 102 87 74 72 69.1 65 87 59 31 20 10.6 5 29.1 29 28.9 0
26 94 86.7 79 71 67.5 63 67 53.5 41 23 14.2 5 28.9 28.9 28.8 0
27 92 80.7 69 72 64.5 58 90 60 35 25 9.3 5 29.1 29 28.9 0
28 85 75.5 67 66 60.9 55 93 63.2 40 13 7.9 0 29.2 29.2 29.1 0
29 90 77.5 63 60 55.2 50 84 50 25 14 3.1 0 29.2 29.2 29.1 0
30 91 81.8 69 63 60 55 78 49.5 32 13 6.5 0 29.1 29.1 29 0
31 94 82 73 71 62.8 58 74 54.1 33 16 7.3 0 29.1 29 29 0
A slight correction for next week.

Excessive heat warning for the southwestern US.
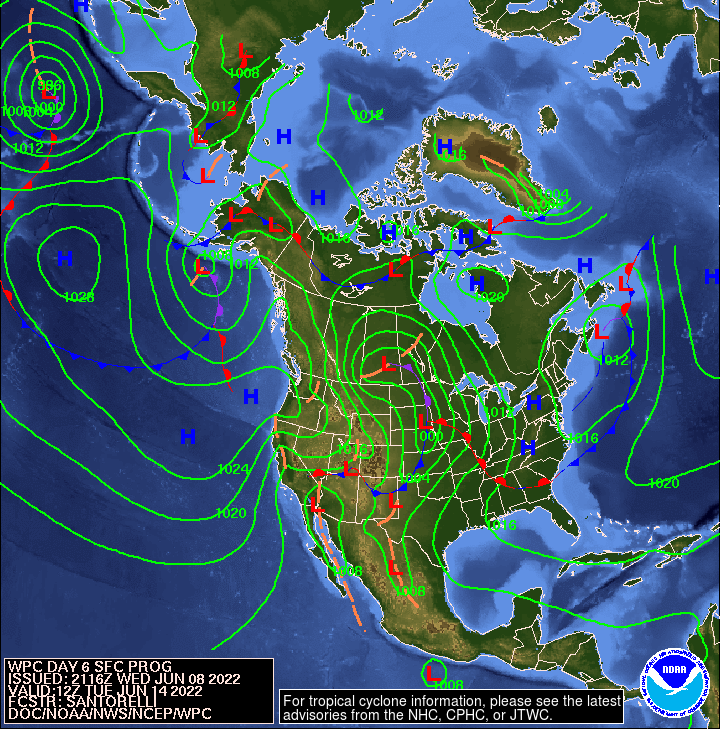
We are lucky that we don't have to deal with excessive heat right now. Remember that it is still technically spring until June 21, 2022. For people living in the southwestern US, they will be experiencing above normal high temperatures. From the NWS:
Short Range Forecast Discussion NWS Weather Prediction Center College Park MD 410 AM EDT Thu Jun 09 2022
...Excessive heat over parts of Central/Southern California and the Southwest on Friday and Saturday as record high temperatures persist over southeastern Texas... Furthermore, upper-level ridging will expand westward over California by Friday. Upper-level ridging and dry soils will combine to allow high temperatures in the upper 90s and 100s for much of Central/Southern California and the Southwest. Little respite overnight as low temperatures are also expected to tie or break records across much of the region on Thursday and Friday nights. Therefore, excessive Heat Warnings are in effect for much of the Southwest. Additionally, excessive Heat Watches/Advisories affect much of Central California and parts of western Nevada. Records in southeast Texas continue to be threatened through the weekend as high temperatures remain in the low 100s.
From the New York Times:
A tornado watch has been issued for southern Indiana.
The tornado watch lasts until 10:00pm but I think the 4-7pm time frame should be watched carefully. Today is definitely not a day to go golfing. If you are out golfing, pack up and leave now.

Tornado Watch
TORNADO WATCH OUTLINE UPDATE FOR WT 333
NWS STORM PREDICTION CENTER NORMAN OK
130 PM CDT WED JUN 8 2022

TORNADO WATCH 333 IS IN EFFECT UNTIL 900 PM CDT FOR THE
 FOLLOWING LOCATIONS

INC005-011-013-019-021-025-027-029-031-035-037-041-043-047-055-
057-059-061-063-065-071-077-079-081-083-093-095-097-101-105-107-
109-115-117-119-121-133-135-137-139-143-145-153-155-161-165-167-
175-177-090200-
/O.NEW.KWNS.TO.A.0333.220608T1830Z-220609T0200Z/

IN
.    INDIANA COUNTIES INCLUDED ARE

BARTHOLOMEW          BOONE               BROWN
CLARK                CLAY                CRAWFORD
DAVIESS              DEARBORN            DECATUR
DELAWARE             DUBOIS              FAYETTE
FLOYD                FRANKLIN            GREENE
HAMILTON             HANCOCK             HARRISON
HENDRICKS            HENRY               JACKSON
JEFFERSON            JENNINGS            JOHNSON
KNOX                 LAWRENCE            MADISON
MARION               MARTIN              MONROE
MONTGOMERY           MORGAN              OHIO
ORANGE               OWEN                PARKE
PUTNAM               RANDOLPH            RIPLEY
RUSH                 SCOTT               SHELBY
SULLIVAN             SWITZERLAND         UNION
VERMILLION           VIGO                WASHINGTON
WAYNE
The weather has been quite tranquil lately.
There isn't much to speak of. Rain showers tonight. Low temperatures in the 50's for the rest of the week. This is very pleasant for the first week of June. Enjoy!
90 degrees again tomorrow.
Why? Because it's Indiana!


A taste of summer next week!


.Long Term...(Friday through Wednesday)
Issued at 239 PM EDT Wed May 4 2022

Quite the pattern change expected to take place in the long term as
cool and wet conditions this weekend transition to hot, humid,
summer-like weather next week.

Friday - Saturday

Nearly stacked area of low pressure in the Central Plains slowly
moves eastward along an E-W oriented boundary stretched across the
Ohio Valley. GFS and EC ensembles still show some spread regarding
the exact track as it moves through Indiana. Larger spread with the
ECE members with the low potentially tracking anywhere from the Ohio
River to the Michigan border; while the GFS ensembles are clustered
in Southern Indiana and right along the Ohio River. NBM currently
splits the difference with the surface low tracking right along the
I-70 corridor. While the overall track will have influence on where
the axis of heaviest rain sets up, surface temperatures, and thunder
potential; confidence is high in below normal temperatures and
widespread rainfall for Central Indiana on Friday.

Current thinking is that rain and elevated thunderstorms along a
warm front will be ongoing Friday morning. As the surface low moves
directly over the region, expect light rain and potentially
thunderstorms to continue through the day. While thunder is in the
forecast across all of Central Indiana, best chance for thunder and
stronger storms remains across South Central Indiana closer to the
warm sector where slightly higher instability exists. Still will
have to monitor the track of the low as a further north track could
bring the potential for strong to severe storms further northward
into Central Indiana. Given the slow nature of this system, there is
a marginal to slight risk of flooding across much of the state as 1
to 2 inches of rain could fall on already saturated grounds.

The low slowly departs to the east on Saturday while high pressure
settles over the region. With abundant low level moisture in the PBL
and high pressure moving in, expect low stratus and possible drizzle
to linger through the day. Expect ceilings to rise during the day;
however with subsidence aloft trapping moisture near the surface and
little to no forcing, clouds will be stubborn to clear out.

As for temperatures, expect a 5 to 10+ degree gradient from north to
south across the area. Confidence is lower with the temperature
forecast as a track farther north (south) will lead to warmer
(cooler) surface temperatures. For now, keeping low to mid 60s
across north Central Indiana and low to mid 70s across South Central
Indiana.

Sunday - Next Week

Beginning Sunday and persisting through next week, a major pattern
change takes place across much of the eastern half of the CONUS as
ridging builds in and a surface high parks itself across the
Northeast. Many forecast signals are pointing towards a summer-like
pattern developing and persisting increasing forecast confidence in
the long term. Cluster analysis reveals strong agreement among
models in a highly amplified ridge over the Great Lakes and
Northeast early to mid week. NAEFS and ENS are indicating 30+ year
climatological maximums in 850 mb temperatures and high moisture
content/humidity levels.

Flow turns southerly on Sunday and increases through early next week
advecting in a much warmer and humid airmass. Temperatures aloft
dramatically increase to 16 to 20C at 850mb by midweek. With a well
mixed atmosphere, expect very steep low level lapse rates mixing
down the anomalously warm air aloft to the surface. Highs in the 80s
expected Monday through at least midweek. Would not be surprised for
a few sites to reach their first 90 degree day of the year sometime
next week as EC ESAT tables show low to mid level temperatures 2 to
3 standard deviations above normal. With all this in mind, went
above NBM guidance for temperatures next week. On top of the summer-
like heat, oppressive mid-summer like humidity values will surge
northward as moist tropical air flows northward from the Gulf of
Mexico. Dew points could potentially reach the lower 70s at times
next week leading to heat indices well into the 90s.

By mid to late next week, guidance indicates a broad upper low
retrograding westward from the Atlantic to the Southeast CONUS. With
the potential for lower pressure moving into a very unstable, warm,
and humid airmass, will have to watch the potential for
thunderstorms once again by the end of next week. Confidence is low
regarding any details past midweek as long term guidance tends to
struggle with the break down of blocking patterns.